
Current status
Gaia was launched on 19 December 2013 at 09:12 UTC. Its nominal mission ended after 5 years of successful operation on July 2019. Due to the availability of fuel and good performance, the mission was extended to 31 December 2022, subject to a mid-term review in 2020.
Next Data Release
The complete schedule of next publication of Gaia data can be found here.
Third Data Release
Gaia Data Release 3 is split into two releases: the early release called Gaia Early Data Release 3 (Gaia EDR3) and the full Gaia Data Release 3 (Gaia DR3). Gaia EDR3 is planned to be released on 3 December 2020 at 12:00 CET. The full Gaia Data Release 3 (Gaia DR3) is planned for the first half of 2022.
As for previous releases, the Gaia (E)DR3 data will be made available through the Gaia Archive and partner data centres. A description of the expected contents of Gaia Early DR3 is given below. An overview page for Gaia Early Data Release 3 helps to find all relevant information for the Gaia EDR3 release.
Contents of Gaia EDR3
- The five-parameter astrometric solution – positions on the sky (α, δ), parallaxes, and proper motions – for around 1.5 billion (1.5 109) sources, with a limiting magnitude of about G ≈ 21 and a bright limit of about G ≈ 3. The astrometric solution wil be accompanied with some new quality indicators, like RUWE, and source image descriptors.
- In addition, two-parameters solutions – positions on the sky (α, δ) – for around 300 million additional sources.
- G magnitudes for around 1.8 billion sources.
- GBP and GRP magnitudes for around 1.5 billion sources.
- Please be aware that the photometric system for the G, GBP, and GRP bands in Gaia EDR3 is different from the photometric system as used in Gaia DR2 and Gaia DR1.
- Full passband definitions for G, GBP, and GRP.
- About 1.5 million celestial reference frame (Gaia-CRF) sources.
- Cross-matches between Gaia EDR3 sources on the one hand and Hipparcos-2, Tycho-2 + TDSC merged, 2MASS PSC (merged with 2MASX), SDSS DR13, Pan-STARRS1 DR1, SkyMapper DR1, GSC 2.3, APASS DR9, RAVE DR5, allWISE, and URAT-1 data on the other hand.
- Additionally, a Gaia EDR3 to Gaia DR2 match will be provided.
- Simulated data from Gaia Object Generator (GOG) and Gaia Universe Model Snapshot (GUMS) will be provided.
- The commanded scan law covering the Gaia EDR3 data collection period will be provided. Also the major periods where data was not sent to the ground or could not be processed are identified.
To ease the use of the data, the Gaia EDR3 table in the Gaia Archive will be complemented with a set of Gaia DR2 radial velocities.
Background of the data
Gaia DR3 data (both Gaia EDR3 and the full Gaia DR3) are based on data collected between 25 July 2014 (10:30 UTC) and 28 May 2017 (08:44 UTC), spanning a period of 34 months. As a comparison, Gaia DR2 was based on 22 months of data and Gaia DR1 was based on observations collected during the first 14 months of Gaia’s routine operational phase.
The reference epoch for Gaia DR3 (both Gaia EDR3 and the full Gaia DR3) is 2016.0. Remember that the reference epoch is different for each Gaia data release (it was was J2015.5 for Gaia DR2 and J2015.0 for Gaia DR1).
Positions and proper motions are referred to the ICRS, to which the optical reference frame defined by Gaia EDR3 is aligned. The time coordinate for Gaia EDR3 is the barycentric coordinate time (TCB).
More info at https://www.cosmos.esa.int/web/gaia/earlydr3#datamodel
Second Data Release
The second Gaia data released was published on 25 April 2018 is available through the Gaia Archive. Gaia DR2 data is based on data collected between 25 July 2014 (10:30 UTC) and 23 May 2016 (11:35 UTC), spanning a period of 22 months of data collection (or 668 days).
It includes five-parameter astrometric solution – positions on the sky (α, δ), parallaxes, and proper motions – for more than 1.3 billion (109) sources, with a limiting magnitude of G = 21 and a bright limit of G ≈ 3.
Median radial velocities for more than 7.2 million stars.
An additional set of more than 361 million sources for which a two-parameter solution is available: the positions on the sky (α, δ) combined with the mean G magnitude.
Here you can find a full description of the contents of this release.
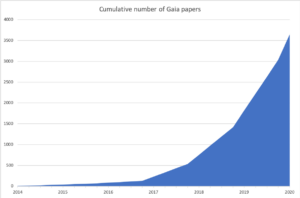
On 25/04/2020 Gaia mission celebrated the second anniversary of Gaia Data Release 2. The Gaia catalogues have been embraced by many scientists across the world. In those 2 years, almost 3000 refereed papers based on Gaia Data Release 2 have been published. That amounts on average to 4 papers per day.
First Data Release
The first Gaia data release DR1, published on 14 September 2016, includes the positions and G magnitude for about one billion stars using observations taken between 25 July 2014 and 16 September 2015.
In addition, for a subset of data – about 2 million stars in common between the Tycho-2 Catalogue and Gaia – there is a five-parameter astrometric solution, giving the positions, parallaxes, and proper motions for those objects. This is referred to as the Tycho-Gaia Astrometric Solution (TGAS).
Photometric data for RR Lyrae and Cepheid variable stars that were observed frequently during a special scanning mode that repeatedly covered the ecliptic poles was also made public.
Below you can see a visualisation of how Gaia scanned the sky during its first 14 months of operations, so for the time period covered by Gaia DR1.
Skymap movie
This “skymap” figure illustrates the areas of the sky that Gaia observed during these roughly five months of Commissioning.
The axes are Equatorial coordinates (right ascension and declination), whereas the colour scale indicates the measurement density (as observations per square degree). Such density depends both on the sky in itself and on the “scanning law” followed by Gaia.
As we can see, there are areas where the density is significantly higher than in others. This is due to the special scanning laws in which Gaia has been operating during these Commissioning months. Specifically, there are two small areas with a very high density: the “ecliptic poles”, that is, the points on the celestial sphere crossed by an imaginary line perpendicular to the ecliptic plane – where the Earth travels on its orbit around the Sun.
This feature is intentional: The Commissioning phase was designed to run mostly on the so-called “ecliptic poles scanning law” (or EPSL), in which the spin axis of Gaia is completely fixed with respect to the Gaia-Sun axis (not doing any precession motion around it). With this we have been observing the ecliptic poles every day, allowing DPAC scientists to use the stars in such poles as references and perform essential diagnostics on the satellite, its instruments and the on-ground data processing systems. This EPSL mode can be either “trailing” or “leading”, that is, with the Gaia spin axis at -45 or +45 degrees with respect to the Gaia-Sun axis on the ecliptic plane.
We have also tested different manoeuvres and scanning modes of the satellite during these months. For example, setting the spin axis to zero degrees with respect to the Gaia-Sun axis (or “sun aspect angle”). Also, and specially, the “nominal scanning law” (NSL), which is the mode in which Gaia operates during nominal mission. This NSL has been tested twice during commissioning – including the “Galactic Plane scan”, in which we observe a very high number of stars almost following the Galactic Plane to stress-test all the systems.
The video nicely illustrates all these manoeuvres. It starts with the EPSL-trailing mode, followed by the EPSL-leading mode (including a short period with a sun aspect angle of zero degrees). A few days later we test the NSL mode, then coming back to EPSL-leading, and finally NSL scanning close to the Galactic Plane.
These “skymap” figures are automatically determined by the Initial Data Treatment (IDT) from the data processed by this system every day, using the star measurements and the attitude information provided by the satellite. The composed image and movie have been prepared by the UB team.
See the same video with scanning law annotation


